


News about maps
Digital cartography and GPS navigation
Mapstor news
This Day in History
Travelling with mapstor.com
Digital cartography and GPS navigation
115 years of flight
Next-generation of GPS satellites are headed to space
DJI Phantom 4 RTK - cartography of a new generation
Earthquake prediction systems
OneSoil map
How maps are created
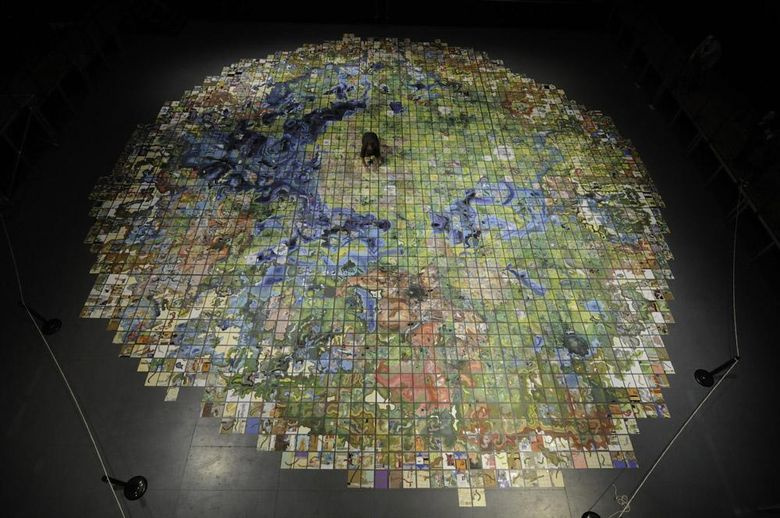
Hand-drawn map in the Massachusetts Museum of Modern Art
For modern cartographers it’s much simpler to create maps than for their colleagues from the past, that have to use far from ideal scheme with very approximate calculations of the location of objects. Until the beginning of the 20th century, cartography changed slowly and, although there were almost no white spots at that time, the maps could display accuracy.
With the beginning of the aerial photography era, mapmakers received an excellent tool that made it possible to draw up a detailed plan for any territory. Satellite imagery was supposed to complete a thousand-year work on creating the ideal orientation tool, but cartographers faced new problems.
As a tool for solving cartographic problems and errors, appeared OpenStreetMap (OSM) project. OSM contains a huge amount of data: not only the images of satellite imagery, but also information that only local residents know. Today we will describe in more detail how the real world is being digitized and becomes a map.
Photofixation of location
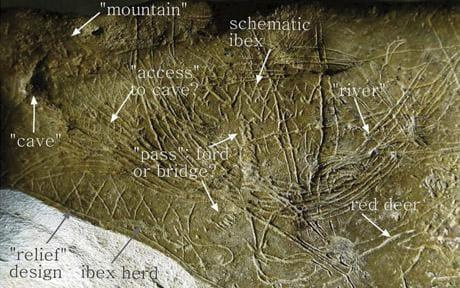
The age of this map is 14 000 years
The first maps appeared in the period of primitive history. Bends of rivers, ridges, ravines, rocky peaks, animal trails - all objects were designated by simple incisions, wavy and straight lines.
The invention of the compass, telescope, sextant, other marine navigation devices, and the subsequent period of the Great Discoveries, led to the flowering of cartography, but the maps were still not accurate enough. The use of various instruments and mathematical methods could not be a solution to the problem - after all, the map was drawn by a person using a description or diagrams created on the place.
A new stage in the development of cartography began with a topographic survey. For the first time, ground-based surveying for the production of topographic maps was carried out in the 16th century, and the first aerial phototopographic surveys of hard-to-reach territories were made in the 1910s. In Russia both cadastral and notorious "maps of the General Staff", accuracy and coverage of which at that time were unprecedented, were created by surveyors with the help of a theodolite.
After aerial photography, a long and complex stage of deciphering is needed. The objects in the image should be identified and recognized, their qualitative and quantitative characteristics should be established, and the results recorded. The method of deciphering is based on the regularities of photographic reproduction of the optical and geometric properties of objects, as well as on the interrelationships of their spatial location. Simply put, three factors are taken into account: optics, image geometry and spatial placement.
To obtain data on the relief, contour-combination and stereotopographic methods are used. With the first method, the heights of the most important points on the surface are determined with the aid of geodetic instruments directly on the terrain and then the horizontal position is applied to the aerial photographs. Stereotopographic method implies partial overlapping of two images with each other in such a way that each of them depicts the same section of terrain. In a stereoscope this section looks like a three-dimensional image. Further on this model are determined the heights of the territory.
Satellite imagery
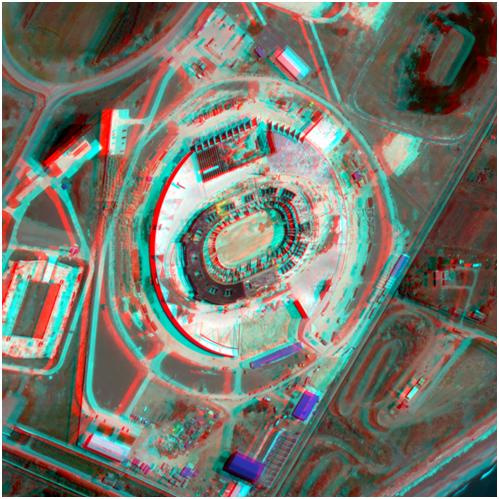
Example of a stereopair from WorldView-1 satellite
The same way, by creating a stereo image, function satellites. Information on the terrain (and many other data, including radar interferometry - the construction of digital terrain models, determination of displacements and deformations of the earth's surface and structures), provide radar and optical satellites of Earth remote sensing.
Satellites of ultra-high resolution do not take pictures all in a row (the endless Siberian forests are not needed in high resolution), but on request for a certain territory. Such satellites include, for example, Landsat and Sentinel (in orbit there are Sentinel-1, responsible for radar imaging, Sentinel-2, the leading optical survey of the Earth's surface and the study of vegetation, and Sentinel-3, which monitors the state of the world's oceans).
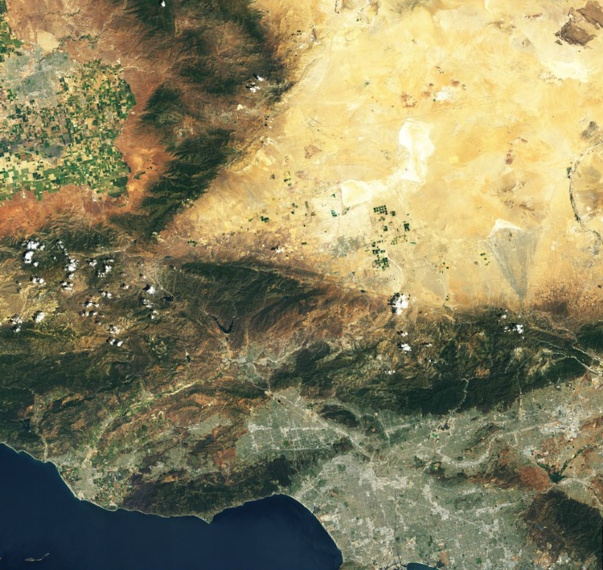
Image of Los Angeles, taken by a satellite Landsat 8
Satellites send data not only in the visible spectrum, but also in the infrared (and several others). Data from the invisible spectral ranges of the human eye allow one to analyze surface types, monitor the growth of crops, detect fires, and much more.
A lot of services are created on the basis of Global Land Survey (GLS) data sets from US Geological Survey (USGS) and NASA. GLS receives data primarily from the Landsat project, which creates satellite images of the entire planet in real time since 1972. Using Landsat, you can get information about the entire earth's surface, as well as about its changes over the past decades. This project for many public mapping services remains the main source of Earth remote sensing data of a small scale.
The MODIS (MODerate-resolution Imaging Spectroradiometer) scanning spectroradiometer is located on the Terra and Aqua satellites that are part of the NASA EOS (Earth Observing System) integrated program. The resolution of the resulting images is coarser than the results of most other satellites, but coverage allows you to receive a daily global collection of images in near real time.
Apart from satellites there is one more perspective direction of "vertical" shooting - getting data from drones. So the company DroneMapper sends drones to film farmlands - it turns out to be more economical than using a satellite or an airplane.
Satellites provide a huge amount of diverse information and can take pictures of the whole Earth, but companies order data only for the territory they need. In connection with the high cost of satellite imagery, companies prefer to detail the territories of large cities. All that is considered sparsely populated area, is usually removed in the most general terms. In regions with constant cloudiness, satellites make new and new images, achieving a clear image and increasing costs. However, some IT companies can afford to purchase pictures from entire countries. For example, Bing Maps.
Based on satellite imagery and measurements on the ground, vector maps are created. Processed vector data is sold to companies that print paper maps and/or create map services. Drawing maps yourself on satellite images is expensive, so many companies prefer to buy a ready-made solution based on Google Maps API or Mapbox SDK and finalize their own staff of cartographers.
Digital cartography and GPS navigation 22-08-2017